Decision tree predictive analytics is one of the most widely used approaches in modern data science. It combines the intuitive, flowchart-like structure of decision trees with the forward-looking power of predictive analytics, allowing businesses and researchers to forecast outcomes with remarkable clarity.
Unlike many complex statistical models, decision trees are easy to visualize and interpret, which makes decision tree predictive analytics especially popular among analysts who need to explain their findings to non-technical stakeholders. In this guide, we’ll explore how decision trees work, why they matter in predictive analytics, and how to build and evaluate them effectively.
At Linkinfotech, we help businesses turn raw, complex datasets into clear, decision-ready insights. Our data analytics approach draws on techniques like decision tree modeling to help teams forecast outcomes with confidence and clarity.
What Is Decision Tree Predictive Analytics?
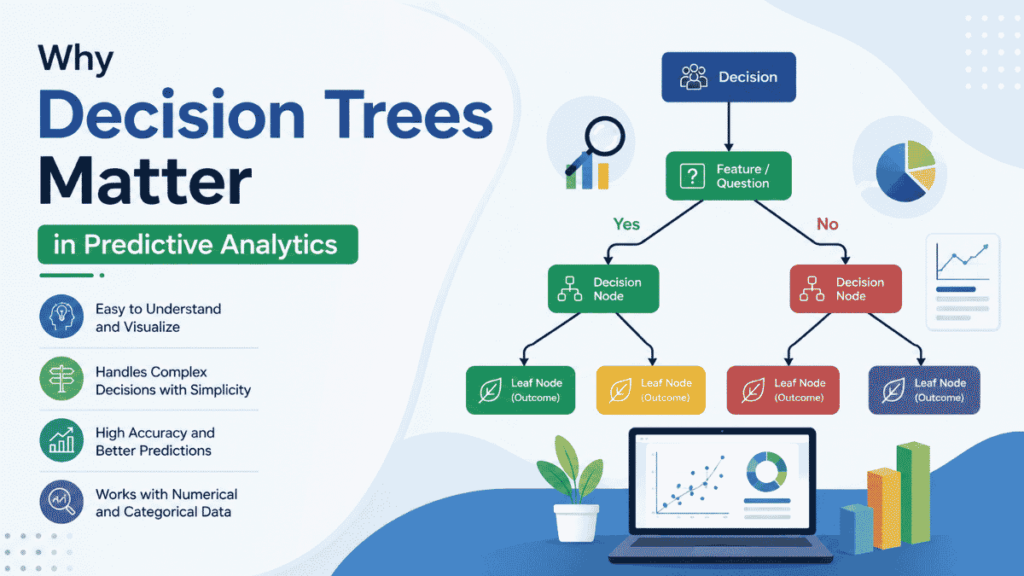
Decision tree predictive analytics refers to using a tree-shaped model to predict outcomes based on a series of decision rules derived from historical data. Each internal node in the tree represents a test on a specific variable, each branch represents the outcome of that test, and each leaf node represents a final predicted value or category.
This approach falls under the broader umbrella of predictive analytics, which focuses on using historical data to forecast future events. However, decision trees stand out because they mirror human decision-making. Instead of relying purely on complex mathematical formulas, they break decisions into a sequence of simple, logical questions.
For example, a bank might use decision tree predictive analytics to determine loan approval likelihood. The tree might first split applicants by income level, then by credit score, then by employment history, ultimately arriving at a predicted approval or rejection outcome.
Turn Survey Data Into Business Decisions Faster
Technology-driven market research for faster, smarter insights.
Why Decision Trees Matter in Predictive Analytics
Decision trees have earned their popularity for good reason. Here’s why they remain such a valuable tool within predictive analytics.
Easy to Interpret
Unlike black-box models, decision trees produce visually intuitive results. Anyone can follow the branching logic from root to leaf, which makes decision tree predictive analytics especially useful when findings need to be explained to executives or clients without technical backgrounds.
Handles Both Categorical and Numerical Data
Decision trees work seamlessly with different data types. Whether you’re predicting a category, such as customer churn versus retention, or a numerical value, like expected revenue, decision trees adapt to both classification and regression tasks.
Requires Minimal Data Preparation
Compared to many other predictive models, decision trees require less preprocessing. They handle missing values reasonably well and don’t require normalization, which simplifies the overall analytics workflow.
Reveals Important Variables
As a tree builds, it naturally identifies which variables have the strongest influence on the outcome. Therefore, decision tree predictive analytics also functions as a variable importance tool, helping analysts understand which factors matter most.
This capability places decision trees alongside other diagnostic techniques, similar to how analysts rely on correlation analysis in statistics to identify relationships between variables before building predictive models.
How Decision Trees Work
To understand decision tree predictive analytics fully, it helps to break down the mechanics behind how a tree is built.
Step 1: Selecting the Root Node
The process begins by identifying the variable that best splits the dataset into distinct groups. This variable becomes the root node, forming the starting point of the entire tree.
Step 2: Splitting the Data
At each node, the algorithm tests different variables and splitting points to determine which split produces the most distinct, homogeneous groups. Common methods used to measure split quality include Gini impurity and information gain.
Step 3: Creating Branches
Once a split is chosen, the data divides into branches based on the outcome of that test. This process repeats recursively, with each new node splitting the data further based on the next most informative variable.
Step 4: Reaching Leaf Nodes
Splitting continues until a stopping condition is met. This could be a maximum tree depth, a minimum number of cases per node, or a point where further splitting no longer improves prediction accuracy. The final nodes, called leaves, represent the predicted outcome.
Step 5: Pruning the Tree
Trees that grow too large risk overfitting, meaning they capture noise rather than genuine patterns. Pruning removes branches that add complexity without meaningfully improving predictive accuracy, resulting in a simpler, more generalizable model.
Types of Decision Trees in Predictive Analytics
Not all decision trees are built the same way. Depending on the type of outcome you’re trying to predict and the complexity of your dataset, different tree structures and algorithms come into play. Understanding these variations helps analysts choose the right approach for decision tree predictive analytics rather than defaulting to a single method for every problem.
Turn Complex Datasets Into Strategic Business Growth
Enterprise-grade data processing, statistical analysis, and customized tabulations to power your insights.
Classification Trees
Classification trees are used when the outcome you’re predicting falls into distinct categories rather than a numerical value. For example, a classification tree might predict whether a customer will churn or stay, or whether a transaction is fraudulent or legitimate. Each leaf node in a classification tree represents a specific class label, and the tree’s job is to split the data in a way that separates these categories as cleanly as possible.
Regression Trees
Regression trees, by contrast, predict continuous numerical values rather than categories. A regression tree might forecast expected revenue, estimated delivery time, or predicted house prices. Instead of ending in a class label, each leaf node represents a numerical prediction, typically calculated as the average value of the training cases that fall into that branch.
CART (Classification and Regression Trees)
CART is one of the most widely used algorithms in decision tree predictive analytics because it can handle both classification and regression tasks within a single framework. CART builds binary trees, meaning each split divides the data into exactly two branches, which keeps the resulting structure relatively simple and easy to interpret. Its flexibility makes it a popular default choice across many industries.
CHAID (Chi-squared Automatic Interaction Detection)
CHAID takes a different statistical approach, using chi-squared tests to determine the best way to split data at each node. Unlike CART, CHAID can create more than two branches at a single split, which makes it especially useful for market research and survey analysis, where variables often have several distinct categories rather than just two.
Random Forests
Random forests extend the basic decision tree concept by building many individual trees and combining their predictions. Each tree in the forest is trained on a slightly different random subset of the data, and the final prediction is based on the average or majority outcome across all trees. This ensemble approach significantly reduces the risk of overfitting that single decision trees are prone to, while generally improving overall prediction accuracy.
Gradient Boosted Trees
Another ensemble approach, gradient boosted trees, builds trees sequentially rather than independently. Each new tree focuses specifically on correcting the errors made by the previous trees in the sequence. This method often achieves higher accuracy than random forests, though it typically requires more careful tuning and longer training time.
Choosing the Right Tree Type
Selecting the appropriate tree type depends on several factors:
- Outcome type – Categorical outcomes call for classification trees; numerical outcomes call for regression trees
- Dataset size – Larger, more complex datasets often benefit from ensemble methods like random forests
- Interpretability needs – A single CART or CHAID tree is easier to explain than a random forest with hundreds of trees
- Accuracy requirements – Ensemble methods generally outperform single trees but sacrifice some transparency in the process
Ultimately, the right choice comes down to balancing prediction accuracy against how easily the results need to be explained to stakeholders.
Decision Trees vs. Other Predictive Analytics Methods
Decision tree predictive analytics is just one of several approaches used to forecast outcomes. Understanding how it compares to other methods helps clarify when it’s the right choice.
Compared to regression-based models, decision trees don’t assume a linear relationship between variables. This makes them more flexible for capturing complex, non-linear patterns in data. However, regression models often outperform decision trees when relationships genuinely are linear and well-defined.
| Aspect | Decision Trees | Regression Models | Prescriptive Analytics | Clustering |
| Primary goal | Predict an outcome using branching decision rules | Predict an outcome by modeling a mathematical relationship | Recommend a specific action based on predictions | Group similar data points together |
| Data requirement | Labeled data (known outcomes) | Labeled data (known outcomes) | Builds on outputs from predictive models | Unlabeled data (no predefined categories) |
| Handles non-linear relationships | Yes, naturally | Limited, unless specifically modeled | Depends on underlying predictive model | Not applicable – not a prediction method |
| Interpretability | High – visual, flowchart-like structure | Moderate – relies on coefficients and equations | Varies by implementation | Moderate – depends on cluster visualization |
| Best suited for | Complex, non-linear patterns; clear decision paths | Well-defined, linear relationships | Going beyond “what will happen” to “what should we do” | Discovering natural groupings within data |
| Example use case | Loan approval prediction | Sales forecasting based on price and demand | Recommending the next best action for a flagged customer | Segmenting customers by behavior |
It’s also worth distinguishing decision tree predictive analytics from prescriptive approaches. While predictive models forecast what is likely to happen, prescriptive methods go a step further by recommending specific actions. Reviewing a clear example of prescriptive analytics helps illustrate this distinction, since prescriptive models often build directly on the predictions generated by tools like decision trees.
Additionally, decision trees differ meaningfully from clustering techniques. While decision trees predict a specific outcome using labeled data, clustering groups similar cases together without predefined categories. Understanding cluster analysis in data mining helps clarify this difference, since both techniques organize data but serve very different analytical purposes.
Common Applications of Decision Tree Predictive Analytics
Decision trees are used across nearly every industry due to their flexibility and interpretability. Here are some of the most common applications:
- Customer churn prediction – Identifying which customers are likely to cancel a subscription
- Credit risk assessment – Predicting loan default likelihood based on financial history
- Healthcare diagnosis support – Assisting in predicting patient outcomes based on symptoms and history
- Marketing segmentation – Determining which customer groups are most likely to respond to a campaign
- Fraud detection – Flagging transactions that match patterns associated with fraudulent activity
Because these applications span such different industries, decision tree predictive analytics has become a foundational technique within broader business analytics strategies.
Building Decision Trees With Analytics Tools
Building an effective decision tree requires the right software and a clear understanding of your data. Many popular analytics platforms include built-in decision tree functionality, ranging from beginner-friendly visual tools to advanced statistical software.

When selecting a platform, it helps to first understand the broader landscape of available data analysis tools, since some platforms specialize in visual, drag-and-drop tree building, while others require more advanced coding knowledge.
For business teams already using dashboard software, it’s also worth exploring whether platforms like Power BI support predictive modelling. Understanding Power BI’s predictive analytics capabilities can help teams decide whether to build decision trees within their existing reporting tools or use dedicated statistical software instead.
Evaluating Decision Tree Performance
Building a tree is only half the process. Evaluating how well it performs is equally important within decision tree predictive analytics.
Key evaluation metrics include:
- Accuracy – The percentage of correct predictions out of all predictions made
- Precision and recall – Especially important for classification trees with imbalanced categories
- Confusion matrix – A table showing correct versus incorrect predictions across categories
- Mean squared error – Used for regression trees to measure prediction accuracy on continuous outcomes
Cross-validation is also essential. Splitting data into training and testing sets ensures the tree performs well on new, unseen data rather than simply memorizing patterns from the training set.
Program Complex Questionnaires and Skip Logic
Expert survey scripting, advanced routing, and multi-language configurations for flawless data collections.
Comparing Decision Trees to Discriminant Analysis
Decision trees aren’t the only classification tool available. Discriminant analysis, a more traditional statistical method, also predicts group membership based on multiple variables. However, the two approaches differ significantly in structure and assumptions.
While decision trees split data through a series of conditional rules, discriminant analysis relies on mathematical functions that assume specific statistical distributions. Reviewing how discriminant analysis works in SPSS provides useful context for analysts deciding between a rule-based approach and a more traditional statistical classification method.
Common Challenges in Decision Tree Predictive Analytics
Despite their strengths, decision trees come with a few notable challenges that analysts should anticipate.
- Overfitting – Trees that grow too complex can capture noise rather than genuine patterns
- Instability – Small changes in data can produce significantly different tree structures
- Bias toward variables with many categories – Certain splitting criteria can favor variables with more possible values
- Limited extrapolation – Trees struggle to predict outcomes far outside the range of training data
Understanding these challenges helps analysts apply appropriate techniques, such as pruning or ensemble methods, to improve model reliability.
Best Practices for Decision Tree Predictive Analytics
To build effective, reliable decision trees, keep these best practices in mind:
- Clean and prepare your dataset thoroughly before building the tree
- Set reasonable limits on tree depth to avoid overfitting
- Use cross-validation to test performance on unseen data
- Compare tree results against other models to confirm reliability
- Prune unnecessary branches to keep the model interpretable
- Regularly retrain trees as new data becomes available
Following these steps consistently leads to more accurate, generalizable predictive models.
Conclusion
Decision tree predictive analytics remains one of the most accessible and powerful tools available for forecasting outcomes. Its intuitive, visual structure makes it easy to interpret, while its flexibility allows it to handle both categorical and numerical predictions across countless industries.
Understanding how decision trees work, how to build them, and how to evaluate their performance, similar to how analysts approach any thorough data analysis process, equips researchers and business teams with a reliable foundation for data-driven decision-making. Whether you’re predicting customer churn, assessing credit risk, or segmenting a marketing audience, decision trees offer a clear, explainable path from raw data to actionable insight.
FAQs
It’s used to forecast outcomes, such as customer behavior, credit risk, or sales trends, by building a tree-shaped model based on historical data patterns.
Decision trees split data through conditional rules rather than assuming a linear relationship, making them more flexible for capturing complex, non-linear patterns.
Overfitting occurs when a tree grows too complex and captures noise rather than genuine patterns, often resulting in poor performance on new, unseen data.
Yes, decision trees generally handle missing values better than many other predictive models, though data quality still significantly affects overall accuracy.
Classification trees predict categorical outcomes, such as yes or no decisions, while regression trees predict continuous numerical values, such as revenue or price.