Raw data rarely arrives ready for use. Before you can build a chart, run a statistical test, or generate a report, you need to clean, organize, and structure the information properly. Understanding how to prepare data for representation and analysis is the foundation of every reliable research or business decision. Without this step, even the most advanced analytics tools will produce misleading results.
This guide walks through the entire data preparation process, from initial collection to the final analysis-ready dataset. Whether you’re a student, researcher, or business analyst, these steps will help you build a solid data foundation.
Why Data Preparation Matters
Data preparation is often called the unglamorous part of analytics. However, it’s arguably the most important stage. Studies consistently show that analysts spend 60-80% of their time preparing data rather than analyzing it. This isn’t wasted effort – it’s essential groundwork.
Poorly prepared data leads to inaccurate conclusions, flawed business strategies, and wasted resources. Therefore, learning how to prepare data for representation and analysis correctly saves time and prevents costly mistakes down the line. Moreover, clean data builds trust in your findings, which matters when presenting results to stakeholders.
Step 1: Collect and Understand Your Raw Data
Before any cleaning begins, you must first understand what you’re working with. This means examining the structure, format, and types of variables in your dataset. Ultimately, this step determines which cleaning techniques you’ll need later.
Start by asking these questions:
- What is the source of this data?
- How many variables and observations does it contain?
- Are there categorical, numerical, or date-based fields?
- Is the data structured, semi-structured, or unstructured?
If your data comes from surveys, the quality of collection directly affects preparation difficulty. A well-designed data collection and survey process reduces errors before they even enter your dataset. Similarly, if you’re gathering feedback through structured forms, using a proper service survey form template ensures consistent, analyzable responses from the start.
Step 2: Clean the Data
Data cleaning is the process of identifying and fixing errors, inconsistencies, and inaccuracies. This step directly answers the core question of how to prepare data for representation and analysis in practical terms.
Remove Duplicates
Duplicate records commonly occur when data is collected from multiple sources or departments. Removing them prevents skewed results and inflated sample sizes. However, always verify duplicates carefully before deletion, since some repeated entries may be legitimate.
Fix Structural Errors
Structural errors include typos, inconsistent capitalization, and mismatched date formats. For instance, one column might list dates as DD-MM-YYYY while another uses MM-DD-YYYY. These inconsistencies must be standardized before analysis begins.
Handle Missing Values
Missing data is one of the most common challenges analysts face. Before deciding how to handle it, explore why the data is missing. Ask:
- Which variables have the most missing values?
- Is there a pattern behind the missingness?
- Would removing these rows bias your results?
Common approaches include deleting incomplete rows, imputing values using the mean or median, or estimating values through regression models. If you’re working in SPSS specifically, learning how to delete missing data in SPSS gives you a practical, software-specific method for this exact problem.
Filter Outliers
Outliers are extreme values that deviate significantly from the general pattern. They can indicate genuine anomalies or simple data entry errors. Common detection methods include Z-scores, boxplots, and standard deviation analysis. Once identified, you can either remove outliers or investigate them further to uncover hidden insights.
Step 3: Transform the Data

Data transformation changes the format, structure, or scale of data to make it analysis-ready. This step is critical when preparing data for representation and analysis across multiple variables with different units.
Standardize and Normalize
Standardizing converts values to a consistent unit of measure. Normalizing scales values to a common range, typically between 0 and 1. Both processes improve comparability between variables, especially when they were originally measured on different scales.
Create New Variables
Sometimes your analysis requires calculated fields, such as averages, ratios, or transformed values. If a relationship between variables isn’t linear, applying a logarithmic or square transformation can help linear models perform better. This is particularly relevant when preparing data for how we analysis data using regression-based techniques.
If you’re moving data between platforms, understanding the process of data from Excel to SPSS transfer is essential. Excel is often used for initial data entry, while SPSS handles the statistical heavy lifting – but the transition between the two must preserve data integrity.
Step 4: Reduce and Organize the Data
Large datasets often contain redundant or irrelevant information. Data reduction simplifies your dataset without losing critical insights. This makes subsequent analysis faster and more accurate.
Feature Selection
This involves choosing only the most relevant variables for your analysis. Fewer, more meaningful variables improve model performance and interpretability.
Sampling
Instead of analyzing an entire population, you can select a representative subset. There are two main approaches:
- Probability sampling – random selection with no bias toward specific data points
- Non-probability sampling – selection based on researcher judgment or convenience
Subsetting
Subsetting allows you to isolate specific rows or columns that meet certain criteria. For example, if you’re only interested in one region, product category, or time period, subsetting narrows your focus to relevant data only.
Once your data is reduced and organized, exploring relationships between variables becomes easier. This is where techniques like what is correlation analysis in statistics come into play, helping you identify how strongly two variables move together.
Step 5: Integrate Multiple Data Sources
If your analysis pulls from several datasets, integration becomes necessary. This involves harmonizing formats and merging datasets based on a shared key, such as customer ID or date.
Harmonization ensures consistency across sources – for example, aligning date formats or standardizing category labels. Merging then combines the datasets into a single, unified file for analysis. This step is especially important in market research, where data often comes from different survey waves or platforms. Reviewing established data analysis techniques in market research can help you structure integration correctly.
Step 6: Choose the Right Tools
Once your data is clean, transformed, and integrated, the next question is which tool to use for analysis. This decision affects how efficiently you can generate insights and representations.
Popular options include:
- SPSS – ideal for statistical testing and academic research
- Excel – useful for quick calculations and basic visualizations
- Power BI – strong for interactive dashboards and business reporting
- R and Python – flexible for custom, code-based analysis
Choosing appropriately depends on your data volume, technical skill, and reporting needs. A broader overview of what are data analysis tools available today can help you compare options before committing to one platform.
Step 7: Represent the Data Visually
Representation is where prepared data becomes understandable. Visualizations transform rows and columns into patterns, trends, and stories. Common representation methods include:
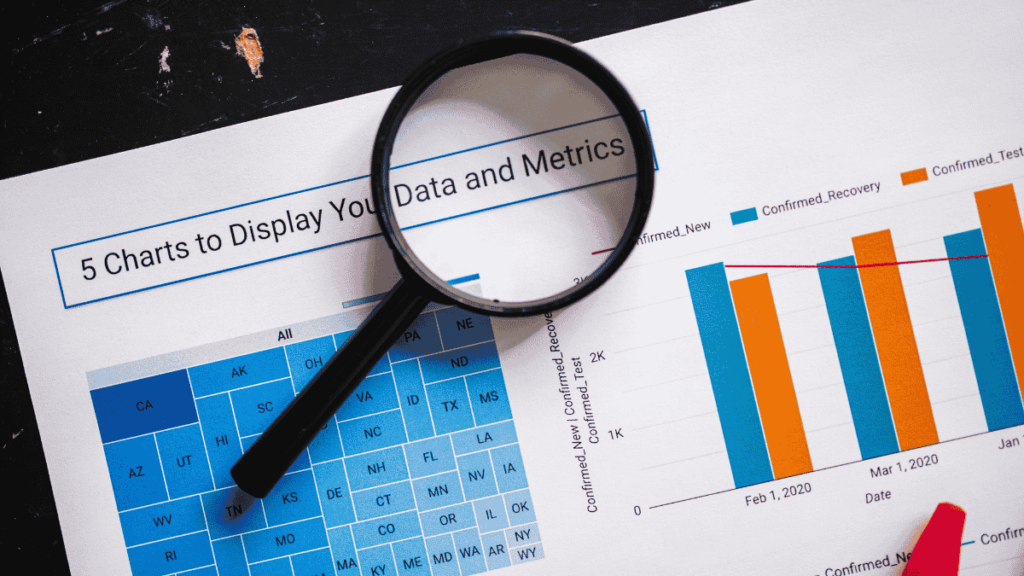
- Bar charts and histograms for frequency distributions
- Line graphs for trends over time
- Scatter plots for relationships between variables
- Cross-tabulation tables for categorical comparisons
Good representation depends entirely on how well the data was prepared beforehand. Poorly cleaned data will always produce misleading charts, regardless of how polished they look. Once your visuals are ready, documenting the process in a clear how-to make data analysis report ensures your findings are communicated effectively to stakeholders.
Step 8: Analyze and Interpret
After preparation and representation, the final step is analysis itself. This is where statistical tests, models, and interpretations come together. Understanding the distinction between analysis approaches also matters here. Many beginners confuse the two, so reviewing data analysis vs data analytics explained simply clarifies which approach fits your specific goal – descriptive analysis or forward-looking analytics.
A Quick Data Preparation Checklist
Before finalizing your dataset, confirm the following:
- Have duplicates been removed?
- Are missing values addressed appropriately?
- Have outliers been identified and handled?
- Are all units standardized and normalized?
- Have irrelevant variables been removed?
- Are multiple data sources properly merged?
- Is the final dataset documented for reproducibility?
Following this checklist consistently improves accuracy and saves significant rework time later.
Common Mistakes to Avoid
Even experienced analysts make preparation errors. Watch out for these common pitfalls:
- Skipping documentation of cleaning steps
- Deleting missing values without investigating patterns first
- Ignoring outliers instead of understanding their cause
- Mixing units without standardizing them
- Merging datasets without checking for duplicate keys
Avoiding these mistakes ensures your representation and analysis remain accurate and trustworthy throughout the process.
Final Thoughts
Learning how to prepare data for representation and analysis is a skill that pays off across every field, from academic research to business strategy. Clean, well-structured data leads to accurate visualizations and trustworthy conclusions. Therefore, investing time in proper preparation isn’t optional – it’s the difference between reliable insights and misleading results. By following the steps outlined above, you’ll build a strong foundation for any analysis project you undertake.
Frequently Asked Questions
Preparing data for analysis means cleaning, transforming, and organizing raw information so it’s accurate, consistent, and ready for statistical testing or visualization.
The main steps include data cleaning, transformation, reduction, integration, and validation. Each step improves data quality and reliability before analysis begins.
Data cleaning removes errors, duplicates, and inconsistencies that could otherwise distort results. Without cleaning, even advanced analysis tools produce inaccurate conclusions.
Data preparation often consumes 60-80% of total project time. This varies based on dataset size, source complexity, and the number of variables involved.
SPSS, Excel, Python, and R are commonly used. The right choice depends on dataset size, required statistical depth, and your technical comfort level.