Interactive Dashboard Services Company
Let’s move a step beyond static presentations, stagnate reports and waiting on analysts to pull reports and then having out-of-date data. Further, it is time to take a step back from spreadsheets and slides. While Excel and PowerPoint, and the various other spreadsheet and presentation applications, remain important business tools for many, their interactivity options are limited.
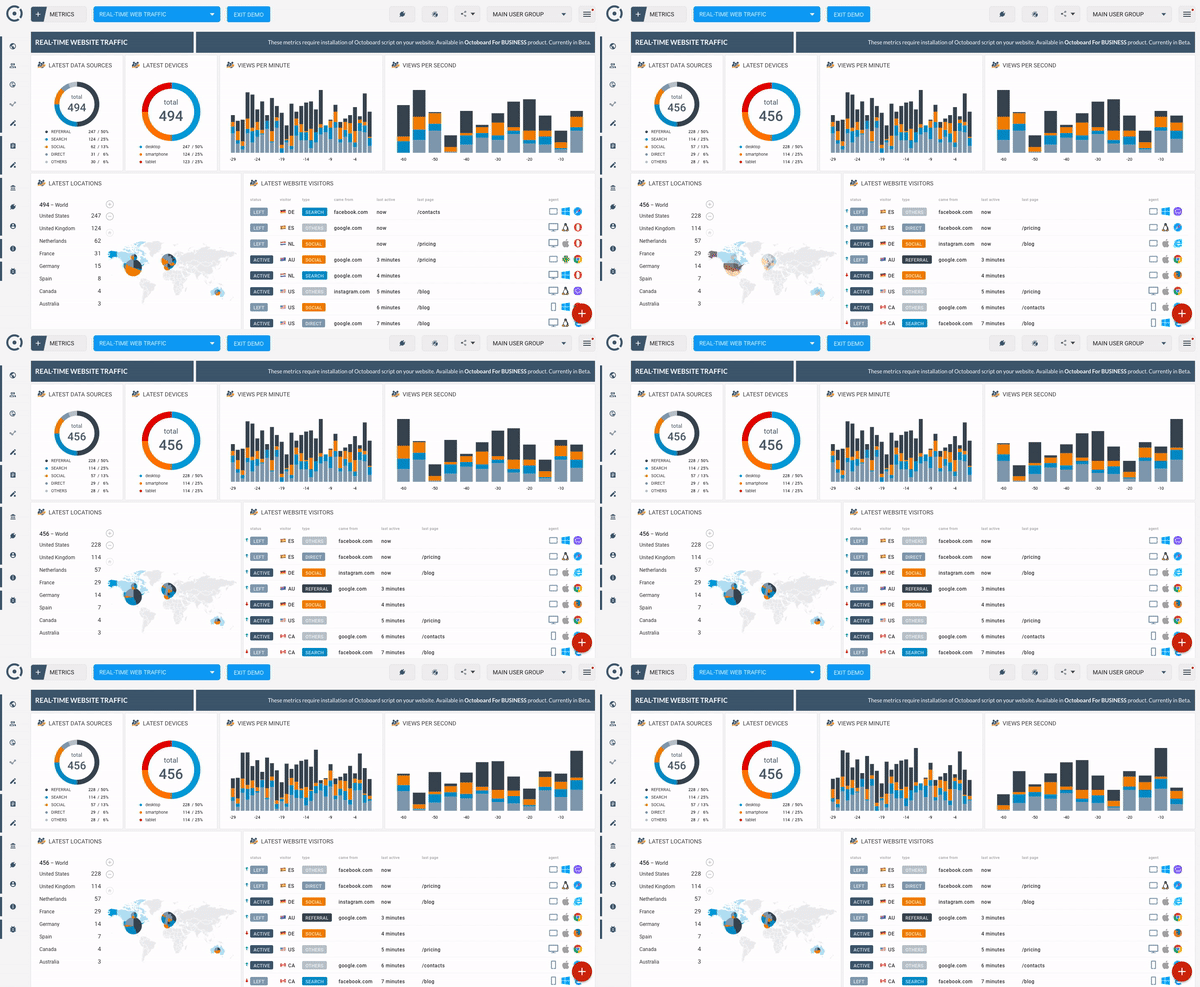
Interactive dashboards quickly engage end-users with a wide range of technical acumen and provide an intuitive experience and easily digested insights. They provide ROI by quickly highlighting trends and dig out irregularities. Dashboards aren’t just for management, they can be easily capitalized on by all teams across a company. They enable to easily visualize data, filter on demand and slice and dice data to dig in deeper. We build interactive dashboards that provide a variety of ways to dissect data. We enable to easily explore the data to discover a wide range of insights.
Interactive dashboards provide businesses with insights that are real time, action oriented and for effective business decision making. Today businesses are looking for options beyond static presentations, stagnate reports and waiting on analysts to pull reports of outdated data. Although office tools such as Excel and PowerPoint and the various other spreadsheet and presentation applications, remain important business tools for many, their interactivity options are limited.

Here are some key benefits that interactive dashboards provide, compared to traditional, static reporting:
- Interactive dashboard empowers users to monitor critical business areas on-demand with the most up-to-date data. Additionally, data can be monitored from various perspectives with just a few clicks. Zooming-in and out, detailing time intervals, filtering countries or show and hide specific parameters that are not needed enables to evaluate data in a most holistic way.
- Dashboard is a one stop solution with interactive features to quickly adapt the displayed data instead of creating 10 static PowerPoint slides. Reports use real-time data, with implemented intelligent auto data analysis that enable users to completely eliminate spreadsheets and presentations. Today dashboards highlight every anomaly along with smart detection and future forecasts.
- By empowering users to perform their own evaluation, a company saves valuable IT resources since the number of requests for database queries or customizations decreases considerably. IT department can focus on valuable tasks while business users can get answers on important business questions quickly.
- Effectiveness today is a crucial element for any company trying to survive in our cutthroat digital age. With modern real-time dashboards real-time data can be accessed and harness the power of business intelligence which resides in its core.
