
Correlation matrix factor analysis sits at the intersection of two essential statistical techniques. A correlation matrix summarizes relationships between variables, while factor analysis uses those relationships to uncover hidden structures within data. Together, they form one of the most powerful tools for simplifying complex, multi-variable datasets.
Whether you’re working with survey responses, psychological assessments, or market research data, understanding correlation matrix factor analysis helps you identify which variables genuinely move together and why. In this guide, we’ll break down both concepts individually, then show how they work together in practice. At Linkinfotech, we help researchers and businesses apply techniques like correlation matrices and factor analysis to real datasets, turning complex survey and research data into clear, actionable insight.
What Is a Correlation Matrix?
A correlation matrix is a table displaying correlation coefficients between multiple variables at once. Rather than examining relationships one pair at a time, a correlation matrix lets you view every possible variable pairing simultaneously, arranged in rows and columns.
Each cell in the matrix shows how strongly two variables relate to one another, typically measured on a scale from -1 to +1. A value near +1 indicates a strong positive relationship, a value near -1 indicates a strong negative relationship, and values close to 0 suggest little to no linear relationship exists.
Understanding these fundamentals connects closely to broader principles behind correlation analysis in statistics, since a correlation matrix is essentially a structured, visual way of presenting many individual correlation calculations at once.
What Is Factor Analysis?

Factor analysis is a statistical technique used to identify underlying factors, sometimes called latent variables, that explain patterns of correlation among a larger set of observed variables. Instead of analyzing dozens of individual survey questions separately, factor analysis groups related questions together based on how strongly they correlate.
For example, several survey questions about workplace satisfaction, such as “I feel valued” and “I enjoy coming to work,” might all correlate strongly with one another. Factor analysis would identify these as reflecting a single underlying factor, perhaps labeled “job satisfaction,” rather than treating each question as an entirely separate measurement.
Why the Correlation Matrix Matters in Factor Analysis
The correlation matrix isn’t just a helpful visualization within factor analysis; it’s the actual starting point of the entire process. Factor analysis relies directly on the correlation matrix to identify which variables cluster together and to what degree.
Turn Survey Data Into Business Decisions Faster
Technology-driven market research for faster, smarter insights.
Here’s why this relationship matters so much:
- The correlation matrix reveals which variables are strongly related before any factors are extracted
- It serves as the mathematical input factor analysis algorithms use to calculate underlying factors
- It acts as a diagnostic tool, helping analysts spot problems before running the full analysis
- It helps determine whether factor analysis is even appropriate for a given dataset
Without a well-constructed correlation matrix, factor analysis results become unreliable, since the entire technique depends on accurately capturing how variables relate to one another.
How Correlation Matrix Factor Analysis Works Together
Understanding how these two techniques connect in practice helps clarify why correlation matrix factor analysis is treated as a single, integrated process rather than two separate steps.
Step 1: Build the Correlation Matrix
The process begins by calculating correlation coefficients between every pair of variables in your dataset. This produces a square, symmetrical table where each variable appears in both the rows and columns.
Step 2: Assess Suitability for Factor Analysis
Before extracting any factors, analysts examine the correlation matrix to confirm factor analysis is appropriate. Generally, you want to see a reasonable number of moderate to strong correlations among variables. If most correlations are very weak, factor analysis may not reveal meaningful underlying structure.
Step 3: Extract Factors
Using the correlation matrix as input, factor analysis algorithms identify a smaller number of underlying factors that explain the observed patterns of correlation. Common extraction methods include principal axis factoring and maximum likelihood extraction.
Step 4: Rotate the Factors
Initial factor solutions are often difficult to interpret. Rotation techniques, such as varimax rotation, adjust the factor structure to make it clearer which variables load most strongly onto each factor.
Step 5: Interpret and Label Factors
Finally, analysts examine which variables load onto each factor and assign meaningful labels based on the shared theme those variables represent.
Interpreting Correlation Coefficients Within the Matrix
Understanding what the numbers in a correlation matrix actually mean is essential before moving into factor extraction. Here’s a general guide to interpreting correlation strength:
- 0.7 to 1.0 (or -0.7 to -1.0) – Strong relationship
- 0.3 to 0.7 (or -0.3 to -0.7) – Moderate relationship
- 0 to 0.3 (or 0 to -0.3) – Weak or negligible relationship
- Exactly 1.0 – Perfect correlation, always found along the matrix’s diagonal, since every variable correlates perfectly with itself
These thresholds aren’t universal rules, and what counts as “strong” can vary depending on the field of study and the nature of the data being analyzed.
Correlation Matrix vs. Regression in Factor Analysis Context
It’s worth distinguishing correlation from regression when discussing correlation matrix factor analysis, since the two are sometimes confused despite serving different purposes.
A correlation matrix simply measures relationships between variables without predicting specific outcomes. Regression, by contrast, builds a predictive model estimating how one variable changes based on another. Reviewing the distinction between correlation and regression analysis helps clarify why factor analysis relies specifically on correlation, not regression, since the goal is to identify shared patterns among variables rather than predict a specific numerical outcome.
Program Complex Questionnaires and Skip Logic
Expert survey scripting, advanced routing, and multi-language configurations for flawless data collections.
Building a Correlation Matrix in Excel
For smaller datasets or preliminary exploration, Excel offers a straightforward way to build a correlation matrix before moving into more advanced statistical software. Using Excel’s built-in correlation function, analysts can quickly generate a matrix showing relationships across multiple variables.
Reviewing how to perform correlation analysis in Excel provides a useful starting point for building this initial matrix, particularly when working with smaller datasets before transitioning to dedicated statistical software for the full factor analysis.
Running Factor Analysis in Statistical Software
While Excel can handle correlation matrix construction, the actual factor extraction process typically requires dedicated statistical software. Programs designed specifically for multivariate analysis offer the algorithms, rotation methods, and diagnostic tools needed for reliable results.
Learning how to run factor analysis in SPSS walks through this process in detail, from generating the initial correlation matrix through extracting and rotating factors, making it a natural next step after building a correlation matrix manually.
Correlation Matrix Factor Analysis and Broader Multivariate Techniques
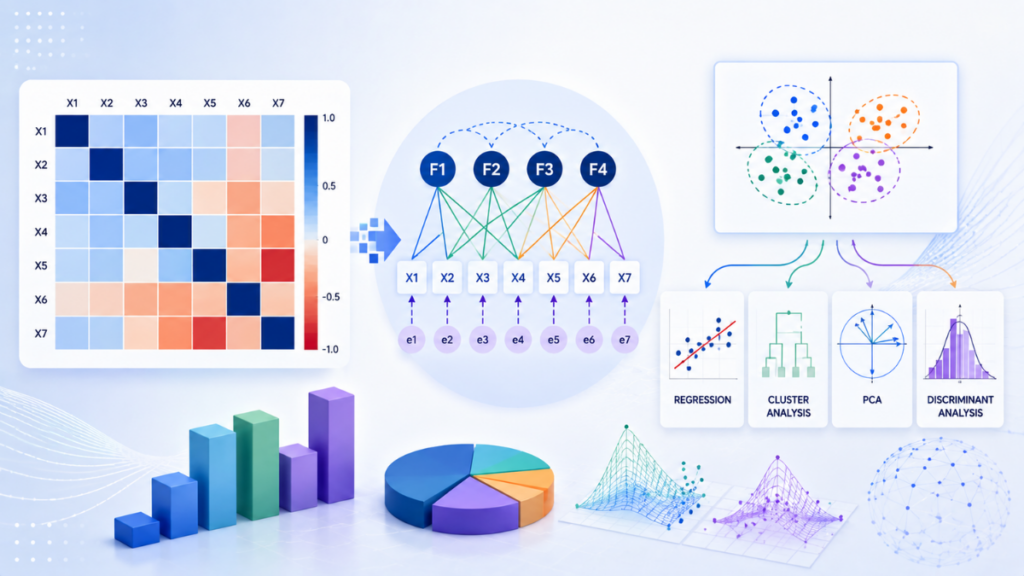
Factor analysis is just one of several multivariate techniques that rely on correlation structures within data. Understanding how it fits alongside other approaches helps clarify when factor analysis is the right choice.
Reviewing the broader landscape of multivariate analysis in SPSS provides useful context, since techniques like discriminant analysis and cluster analysis also examine relationships across multiple variables, though each serves a distinct analytical purpose.
Common Applications of Correlation Matrix Factor Analysis
This combined technique appears across many fields, wherever researchers need to simplify complex, multi-variable data into meaningful underlying dimensions.
- Psychology and social science – Identifying underlying personality traits or attitudes from survey responses
- Market research – Grouping related product attributes or brand perceptions into broader themes
- Customer satisfaction studies – Reducing dozens of survey items into a handful of core satisfaction dimensions
- Finance – Identifying underlying factors driving co-movement among different stock prices
- Healthcare research – Uncovering latent patterns among patient symptoms or characteristics
Across all these applications, the underlying logic remains the same: use the correlation matrix to reveal which variables move together, then use factor analysis to explain why.
Handling Missing Data Before Building a Correlation Matrix
Missing data can significantly distort a correlation matrix, and by extension, any factor analysis built on top of it. Before running your analysis, it’s essential to address gaps in your dataset appropriately.
This step overlaps closely with best practices for handling missing data in SPSS, since decisions about how to treat missing values, whether through deletion or imputation, directly affect the accuracy of the resulting correlation coefficients.
Common Mistakes in Correlation Matrix Factor Analysis
Even experienced analysts run into pitfalls when working with this technique. Here are the most frequent issues to watch for:
- Assuming correlation implies causation – A strong correlation shows a relationship, not a cause-and-effect link
- Ignoring sample size – Small samples can produce unstable or misleading correlation estimates
- Overlooking non-linear relationships – Standard correlation matrices only capture linear patterns
- Skipping suitability checks – Running factor analysis on a matrix with mostly weak correlations produces unreliable factors
- Misinterpreting factor loadings – Failing to set a clear threshold for which variables genuinely belong to each factor
Avoiding these mistakes ensures your correlation matrix factor analysis produces results that are both statistically sound and practically meaningful.
Reporting Your Findings Clearly
Once factors have been extracted and labelled, communicating the results clearly matters just as much as the analysis itself. This aligns with broader standards found in data analysis and interpretation in quantitative research, where findings must be presented with appropriate context about strength, significance, and any limitations in the underlying data.
Turn Complex Datasets Into Strategic Business Growth
Enterprise-grade data processing, statistical analysis, and customized tabulations to power your insights.
Best Practices for Correlation Matrix Factor Analysis
To summarize, here are the core best practices for using this technique effectively:
- Clean and prepare your data thoroughly before building the correlation matrix
- Check for a reasonable number of moderate to strong correlations before proceeding to factor extraction
- Choose an appropriate rotation method to improve interpretability
- Set a clear, consistent threshold for meaningful factor loadings
- Label factors based on genuine thematic patterns, not forced interpretations
- Document your methodology thoroughly for reproducibility
Following these practices consistently leads to more reliable, interpretable factor solutions.
Conclusion
Correlation matrix factor analysis offers a powerful way to simplify complex datasets by revealing the underlying structure connecting many individual variables. By starting with a well-constructed correlation matrix and carefully extracting meaningful factors, researchers can transform overwhelming amounts of data into clear, actionable insights.
Whether you’re studying customer satisfaction, personality traits, or market research attributes, mastering this combined technique equips you with a genuinely valuable tool for uncovering patterns that aren’t visible when examining variables one at a time.
FAQs
A correlation matrix displays relationships between variable pairs, while factor analysis uses that matrix to identify underlying factors that explain those patterns of correlation.
There’s no strict minimum, but factor analysis generally works best with a reasonably large number of variables and a sufficient sample size to produce stable correlation estimates.
No, standard correlation matrices capture linear relationships only. Two variables with a strong non-linear relationship can still show a correlation coefficient close to zero.
Dedicated statistical software offers the most reliable results, though Excel can be useful for building an initial correlation matrix before moving into more advanced factor extraction tools.
Look for a reasonable number of moderate to strong correlations among your variables. If most correlations are very weak, factor analysis is unlikely to reveal meaningful underlying structure.