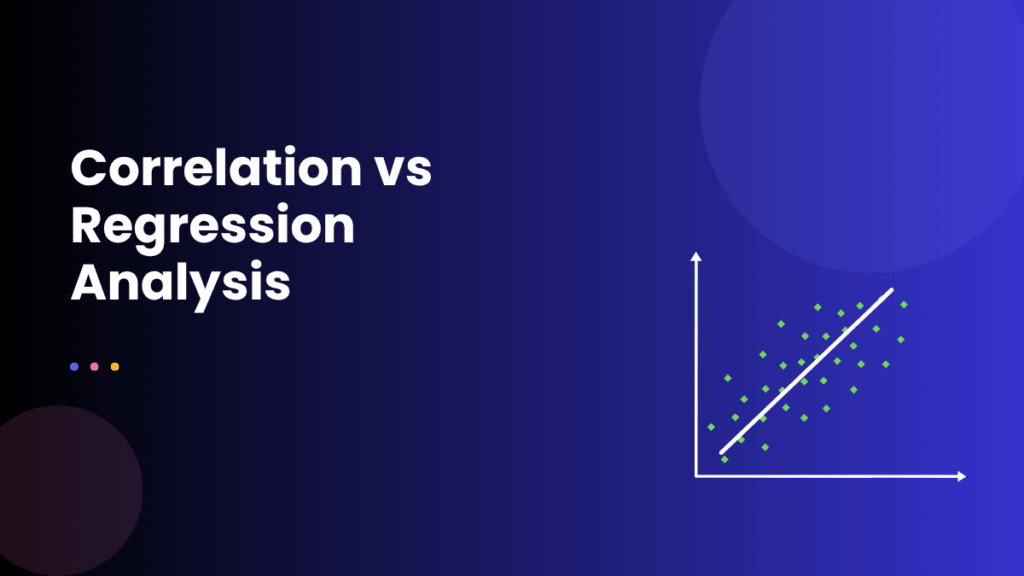
Data analysis relies on many statistical techniques. However, two methods confuse beginners more than almost any others – correlation and regression.
Researchers, students, and analysts often use these terms interchangeably. That is a mistake. Understanding the difference between correlation and regression analysis helps you choose the right method every time.
Correlation tells you whether a relationship exists between two variables. Regression tells you how one variable affects another – and by how much.
In this guide, you will learn both concepts from the ground up. Moreover, you will understand exactly when to use each one in real research scenarios.
Turn Survey Data Into Business Decisions Faster
Technology-driven market research for faster, smarter insights.
What Is Correlation Analysis?
Correlation measures the strength and direction of a relationship between two variables. It answers one simple question: Do these two variables move together?
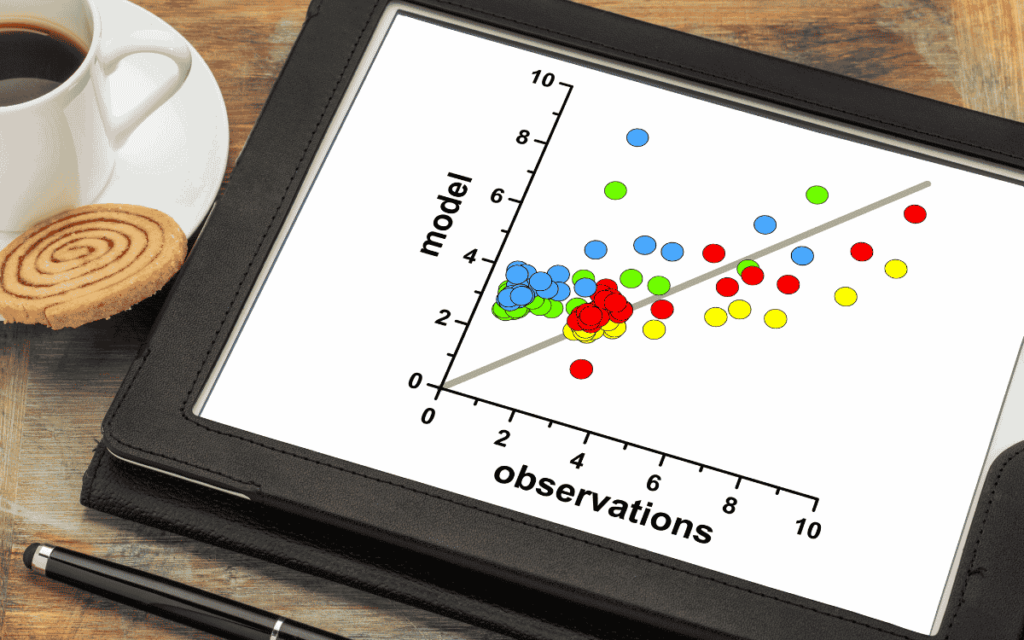
The result is called the correlation coefficient, represented by r. It always falls between −1 and +1.
Here is what each value means:
- r = +1 – Perfect positive relationship. Both variables increase together.
- r = 0 – No relationship. One variable does not affect the other.
- r = −1 – Perfect negative relationship. As one increases, the other decreases.
For example, temperature and ice cream sales show a positive correlation. As the temperature rises, ice cream sales also rise. However, this does not mean one causes the other.
Correlation is symmetrical. The correlation between X and Y is the same as the correlation between Y and X. Neither variable holds a special role.
If you want to understand how correlation analysis works in statistics, starting with the coefficient is the right first step before moving to more complex techniques.
What Is Regression Analysis?
Regression analysis goes several steps further. It not only confirms a relationship but also quantifies the effect of one variable on another.
Regression uses an equation to model that relationship:
Y = a + bX
Where:
- Y = dependent variable (the outcome you are predicting)
- X = independent variable (the predictor)
- a = intercept (value of Y when X = 0)
- b = slope (how much Y changes for each unit increase in X)
For example, a business might use regression to predict sales revenue (Y) based on advertising spend (X). The equation gives a precise number, not just a direction.
Regression is asymmetrical. Swapping X and Y gives you a completely different result. One variable must be the predictor. The other must be the outcome.
Therefore, regression is the tool of choice when you want to predict, estimate, or forecast future values from known data.
The Core Difference Between Correlation and Regression Analysis
This is the heart of the topic. Both methods examine relationships between variables. However, they serve entirely different analytical purposes.
| Feature | Correlation | Regression |
| Purpose | Measures the strength of the relationship | Predicts one variable from another |
| Output | Coefficient (r) between −1 and +1 | Equation with slope and intercept |
| Variable roles | Both variables are equal | One is independent, one is dependent |
| Symmetry | Symmetric (X,Y = Y,X) | Asymmetric (X→Y ≠ Y→X) |
| Causation | Does not imply causation | Suggests directional influence |
| Prediction | Cannot predict values | Can generate predictions |
| Hypothesis testing | Tests if r ≠ 0 | Test the significance of each coefficient |
The most important rule to remember is this: correlation does not imply causation. Two variables can move together perfectly without one causing the other.
Regression, however, models a directional relationship. It assumes the independent variable has a measurable effect on the dependent variable.
Types of Correlation
Not all correlation methods work the same way. Researchers choose based on their data type and distribution.
Pearson Correlation (r)
- Used for two continuous variables
- Assumes a linear relationship
- Requires normally distributed data
- Most widely used in quantitative research
Spearman Rank Correlation (ρ)
- Used for ordinal data or non-normal distributions
- Ranks the values first, then measures correlation
- More robust against outliers
Kendall’s Tau (τ)
- Another rank-based measure
- Better for small sample sizes
- Used when many tied ranks exist in the data
Choosing the wrong type of correlation can lead to misleading results. Therefore, always check your data type before selecting a method.
Types of Regression
Regression also comes in multiple forms. Each suits a different type of data and research objective.
Simple Linear Regression
- One independent variable predicts one dependent variable
- The relationship follows a straight line
- Best starting point for beginners
Multiple Linear Regression
- Two or more independent variables predict one outcome
- Common in marketing, economics, and social research
- Allows you to control for confounding variables
Logistic Regression
- Predicts a binary outcome (yes/no, pass/fail)
- Output is a probability between 0 and 1
- Widely used in healthcare and risk analysis
Polynomial Regression
- Captures curved, non-linear relationships
- Useful when a straight line cannot fit the data
Understanding these variations is part of building strong data analysis and interpretation skills in quantitative research, where choosing the right model directly affects the quality of your conclusions.
Turn Complex Datasets Into Strategic Business Growth
Enterprise-grade data processing, statistical analysis, and customized tabulations to power your insights.
When to Use Correlation vs Regression
Choosing between the two methods depends on your research question. Ask yourself these questions before starting:
Use correlation when:
- You want to explore whether a relationship exists
- You have no hypothesis about which variable influences the other
- You are in the early stage of data exploration
- You need a quick measure of association strength
Use regression when:
- You want to predict or estimate a specific value
- You have a clear independent and dependent variable
- You need to quantify the effect of one variable on another
- You want to control for multiple influencing factors
For example, a market researcher might first run a correlation to check if customer satisfaction relates to repeat purchases. If a strong correlation exists, they then run a regression to predict how much a 10-point increase in satisfaction would boost the repeat purchase rate.
This two-step approach is common in market research surveys where analysts move from exploration to prediction systematically.
Similarities Between Correlation and Regression

Despite their differences, both methods share several important features.
Both correlation and regression:
- Measure the relationship between quantitative variables
- Assume a linear relationship between the variables being examined
- Use scatter plots for the visual representation of the data
- Are sensitive to outliers that can distort results
- Require a sufficient sample size for reliable results
- From the foundation of more advanced multivariate techniques
Moreover, a mathematical link connects them. The square of Pearson’s correlation coefficient (r²) equals the R-squared value in simple linear regression. This value tells you what percentage of variation in Y is explained by X.
For instance, if r = 0.8, then r² = 0.64. This means 64% of the variation in Y is explained by X. That is a strong, useful result.
Real-World Examples
Understanding these methods in context makes them far easier to apply correctly.
Example 1 – Healthcare Research
A researcher studies the relationship between daily exercise hours and blood pressure levels.
- Correlation reveals that more exercise correlates negatively with blood pressure (r = −0.72).
- Regression then builds an equation: for every additional 30 minutes of daily exercise, blood pressure drops by 4 mmHg on average.
Example 2 – Market Research
A brand manager examines the link between advertising spend and product awareness.
- Correlation shows a strong positive relationship (r = 0.85).
- Regression quantifies it: every additional ₹1 lakh in spend increases brand awareness by 6.2 percentage points.
Example 3 – Education
An academic studies whether study hours predict exam scores.
- Correlation confirms the variables are strongly related (r = 0.78).
- Regression produces a prediction equation: Score = 40 + 5.5 × (Study Hours).
These examples show why knowing the difference between correlation and regression analysis prevents analytical errors in practice.
How to Run These Analyses in SPSS
SPSS makes both analyses accessible through simple menus. No coding is needed for either method.
Running Correlation in SPSS:
- Go to Analyze → Correlate → Bivariate
- Move your variables into the Variables box
- Select Pearson or Spearman based on your data
- Click OK
The output shows a correlation matrix with r values and significance levels.
Running Regression in SPSS:
- Go to Analyze → Regression → Linear
- Move your outcome variable into the Dependent box
- Move your predictor(s) into the Independent(s) box
- Click Statistics and check Estimates and Model Fit
- Click OK
The output gives you the R-squared value, beta coefficients, and p-values for each predictor.
For a step-by-step foundation, a solid SPSS tutorial for data analysis walks you through both procedures with practical dataset examples. You can also explore how to perform multivariate analysis in SPSS once you are comfortable with the basics.
Common Mistakes to Avoid
Even experienced analysts make these errors. Knowing them in advance saves time and ensures accurate results.
- Assuming causation from correlation – A strong r value does not prove that one variable causes the other
- Ignoring outliers – A single extreme data point can inflate or deflate both r and regression coefficients
- Reversing variables in regression – Swapping X and Y in regression gives a completely different, incorrect model
- Skipping assumption checks – Both methods assume linearity. Regression additionally requires normally distributed residuals and homoscedasticity
- Confusing r with r² – Correlation coefficient and R-squared are different. Do not use them interchangeably in reporting
Correlation and Regression in Predictive Analytics
Both methods also play a foundational role in more advanced analytical work. Regression, in particular, forms the backbone of predictive modelling.
Many data science tools – including machine learning algorithms – build directly on regression principles. Understanding the basics of how regression estimates outcomes helps you grasp more advanced models later.
Additionally, understanding whether your variables have predictive or purely descriptive value shapes your entire analytical strategy. Correlation identifies candidates. Regression builds the model.
For organisations running ongoing research programmes, combining both techniques within a structured data collection and survey framework strengthens the reliability of every finding.
Quick Reference Summary
Here is a concise recap of everything covered:
Correlation:
- Measures relationship strength and direction
- Output: r value (−1 to +1)
- No prediction; no variable hierarchy
- Use for exploration and association testing
Regression:
- Models the effect of one variable on another
- Output: equation with slope, intercept, and R²
- Enables prediction of future values
- Use when you have a clear predictor and outcome
The difference between correlation and regression analysis is ultimately about purpose. One describes. The other predicts.
Program Complex Questionnaires and Skip Logic
Expert survey scripting, advanced routing, and multi-language configurations for flawless data collections.
Conclusion
Both correlation and regression are essential statistical tools. However, they answer fundamentally different questions.
Correlation shows you the presence and strength of a relationship. Regression shows you the nature and size of an effect – and lets you make predictions from it.
Understanding the difference between correlation and regression analysis makes you a sharper analyst. You choose the right method, interpret results correctly, and communicate findings with confidence.
Moreover, mastering both lays the groundwork for more advanced work in data science, machine learning, and research analytics.
Ultimately, the best analysts do not just run tests. They understand what each test truly reveals – and what it cannot.
Frequently Asked Questions
Yes. You can run a correlation analysis without ever building a regression model. Correlation simply measures association. Regression requires you to define which variable is the predictor and which is the outcome, making it a separate, more structured step.
Not necessarily. A high value confirms a strong linear relationship. However, prediction accuracy in regression also depends on sample size, outliers, and whether the relationship is truly linear throughout the full data range.
Yes, but it is not best practice. Checking correlation first helps confirm that a meaningful linear relationship exists. Running regression on unrelated variables produces statistically meaningless coefficients and a near-zero R-squared value.
R-squared tells you what percentage of the variation in the dependent variable is explained by the independent variable(s). An R-squared of 0.75 means 75% of the variation in Y is accounted for by your model. Higher values indicate a better model fit.
No. Each method suits different questions. If you only need to know whether two variables are related, correlation is sufficient and simpler. If you need to predict, estimate, or model a specific outcome, regression is the correct tool.