Predicting outcomes from historical data sits at the heart of modern analytics. Whether it’s forecasting house prices, estimating sales, or predicting customer churn, one technique shows up again and again. Understanding what regression analysis in data mining is helps you make sense of these predictions and the math behind them.
This guide explains the concept clearly, covers the major regression types, and shows how businesses apply it to real decisions.
At Linkinfotech, we help businesses build and interpret regression models as part of our broader data analysis and SPSS statistical services. Our team works with organizations to turn historical datasets into reliable, decision-ready predictions – exactly the kind of forecasting this guide walks through.
What Is Regression Analysis in Data Mining?
What is regression analysis in data mining, exactly? It’s a statistical technique used to model the relationship between a dependent variable and one or more independent variables. The goal is to predict the value of the dependent variable based on known values of the independent variables.
For example, if you want to predict house prices, price becomes the dependent variable. Size, location, and number of bedrooms become the independent variables. By analyzing historical data, a regression model learns how these factors influence price and predicts new outcomes accordingly.
In simple terms, what is regression analysis in data mining used for? It answers “how much” and “how likely,” turning raw historical patterns into forward-looking predictions.
Why Regression Matters in Data Mining
Data mining involves extracting useful patterns from large datasets. Regression plays a central role because it doesn’t just describe data – it predicts it. This predictive power makes it valuable across finance, healthcare, marketing, and operations.

Businesses use regression to forecast demand, estimate risk, and optimize pricing. Researchers use it to test relationships between variables and validate hypotheses. Moreover, regression models are relatively easy to interpret compared to more complex machine learning methods, which makes them a practical starting point for many analytics projects.
Turn Survey Data Into Business Decisions Faster
Technology-driven market research for faster, smarter insights.
Types of Regression Techniques in Data Mining
Several regression techniques exist, each suited to different data types and relationships. Choosing the right one significantly affects prediction accuracy.
Linear Regression
Linear regression assumes a straight-line relationship between the dependent and independent variables. It’s the most widely used regression technique because of its simplicity and interpretability.
The model estimates a slope and intercept that minimize the difference between predicted and actual values. This method works well when the underlying relationship between variables is genuinely linear.
Logistic Regression
Logistic regression predicts categorical outcomes rather than continuous values. It estimates the probability that a data point belongs to a particular category, such as “will churn” or “won’t churn.”
Unlike linear regression, it uses a specific mathematical function to keep predicted probabilities between 0 and 1. This makes it especially useful for binary classification problems in data mining.
Polynomial Regression
Polynomial regression handles relationships that aren’t linear. It fits a curved line to the data instead of a straight one, capturing more complex patterns between variables.
However, higher-degree polynomial models risk overfitting. Analysts must balance flexibility with generalizability when choosing the right degree.
Ridge and Lasso Regression
Both ridge and lasso regression address a common problem: too many independent variables, some of which may be irrelevant or highly correlated. Ridge regression shrinks coefficients to reduce instability without eliminating variables.
Lasso regression, by contrast, can shrink some coefficients to exactly zero. This effectively performs variable selection alongside prediction, which is useful for large, complex datasets.
Regression vs Other Data Mining Techniques
Regression is just one of several data mining approaches. Understanding how it compares to other techniques clarifies when to use it.
Regression predicts continuous values, while classification techniques sort data into categories. Clustering, meanwhile, groups similar data points without predicting anything at all. For a clearer picture of how regression differs from related statistical measures, this comparison of correlation vs regression analysis is a useful starting point.
Before applying regression, many analysts first check whether variables are related at all. This foundational step relies on a different but connected technique. This guide on correlation analysis in statistics explains how that relationship is measured.
Regression also differs fundamentally from clustering, which groups data without any predefined outcome variable. This overview of cluster analysis in data mining explains how that unsupervised approach works.
Additionally, when the goal is predicting group membership rather than a continuous number, discriminant methods often apply instead. This guide on discriminant analysis in SPSS covers that related technique in detail.
How to Perform Regression Analysis
Running a regression model involves a structured process. Skipping steps often leads to unreliable predictions.
- Define the outcome you want to predict. Identify your dependent variable clearly.
- Select relevant independent variables. Choose factors that logically influence the outcome.
- Prepare and clean your data. Remove errors, duplicates, and inconsistent values.
- Choose the right regression type. Match linear, logistic, or polynomial models to your data pattern.
- Train and test the model. Validate predictions against real outcomes.
- Interpret coefficients carefully. Understand what each variable contributes to the prediction.
Many analysts also cross-check relationships using spreadsheet tools before building a full model. This guide on correlation analysis in Excel explains how to run that preliminary check.
Turn Complex Datasets Into Strategic Business Growth
Enterprise-grade data processing, statistical analysis, and customized tabulations to power your insights.
Choosing the Right Tools for Regression Analysis
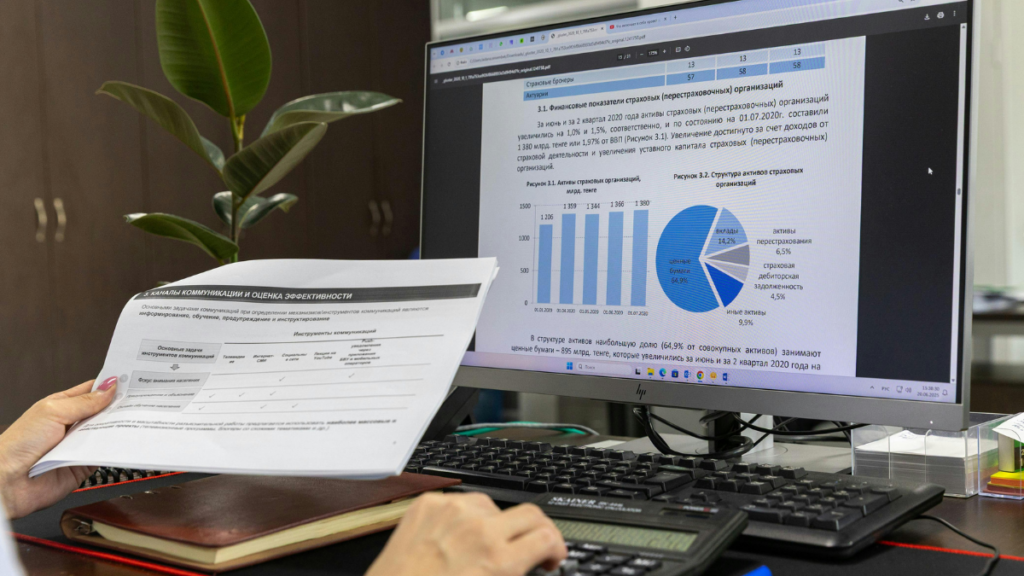
You can run regression using a range of statistical software, from spreadsheets to advanced analytics platforms. The right choice depends on dataset size, complexity, and your team’s technical comfort.
Selecting appropriate tools early prevents wasted time later in the modeling process. For a broader comparison of available options, this guide on data analysis tools breaks down what each platform offers.
For more advanced predictive work involving multiple variables at once, analysts often move beyond simple regression. This guide on multivariate analysis in SPSS explains how to model several variables together.
Common Challenges in Regression Analysis
Even well-built regression models face practical obstacles. Recognizing these early helps prevent misleading results.
- Overfitting: Models that fit training data too closely often fail on new data.
- Multicollinearity: Highly correlated independent variables distort coefficient estimates.
- Outliers: Extreme values can heavily skew regression results.
- Nonlinear relationships: Forcing a linear model onto curved data produces poor predictions.
Addressing these issues improves both accuracy and the credibility of your findings. Careful data preparation remains the best defence against most of these problems.
Applying Regression in Research and Business
Regression analysis plays a significant role in both academic research and applied business analytics. Researchers use it to test hypotheses and control for confounding variables when studying relationships between factors.
This foundational role connects closely to broader research practices. This guide on data analysis and interpretation in quantitative research offers useful context for how regression fits into a larger study design.
In business settings, teams apply regression as part of a broader analytical workflow, often alongside descriptive summaries and diagnostic checks. This overview on how data analysis works explains how regression typically fits into that end-to-end process.
Program Complex Questionnaires and Skip Logic
Expert survey scripting, advanced routing, and multi-language configurations for flawless data collections.
Conclusion
So, what is regression analysis in data mining, ultimately? It’s a foundational technique for predicting outcomes based on historical relationships between variables. From simple linear models to more advanced ridge and lasso techniques, regression offers flexible tools for a wide range of prediction problems.
Success depends on choosing the right regression type, preparing clean data, and validating results carefully. With a structured approach, regression remains one of the most practical and interpretable tools in any analyst’s toolkit.
Frequently Asked Questions
It’s used to predict a continuous or categorical outcome based on the relationship between a dependent variable and one or more independent variables.
Linear regression predicts continuous numeric outcomes, while logistic regression predicts probabilities for categorical outcomes, like yes or no.
Use ridge or lasso when you have many independent variables, especially if some are highly correlated or potentially irrelevant.
No. Regression predicts continuous values, while classification assigns data points into distinct categories.
Ignoring multicollinearity or outliers. Both can distort results significantly if left unaddressed during data preparation.