Organizations no longer want to know only what happened – they want to know what happens next. This shift is exactly why predictive analytics using SPSS has become a core skill for analysts, researchers, and business teams. SPSS combines statistical rigor with an accessible interface, making it one of the most widely used tools for forecasting outcomes from historical data.
This guide explains how predictive analytics in SPSS works, the techniques that power it, and how to apply it to real business problems.
At Linkinfotech, we help businesses and researchers build predictive SPSS models through our data analysis and survey research services. Our team handles everything from data cleaning to model validation, so the forecasts you get are accurate and ready to act on.
What Is Predictive Analytics Using SPSS?
Predictive analytics using SPSS refers to applying statistical models in SPSS to forecast future outcomes based on existing data. It draws on algorithms such as regression, classification trees, and support vector machines to identify patterns that predict what is likely to happen next.
IBM’s own documentation lists several core algorithms available for this purpose, including generalized linear models, linear regression, linear support vector machines, random trees, and CHAID. Each method suits a different type of prediction problem, from continuous numeric outcomes to categorical classifications.
However, prediction is only one branch of a broader analytics ecosystem. Understanding how predictive work differs from broader analytics strategy helps before you dive deeper. This comparison of predictive analytics vs data analytics explains the distinction clearly.
Why Businesses Rely on SPSS for Predictive Work
SPSS became popular because it removes much of the coding burden from statistical modelling. Analysts can build, test, and refine predictive models through a visual interface rather than writing scripts from scratch.

According to Ironside Group’s overview of IBM SPSS, the software connects data to action across planning, management, and optimization functions. Businesses use it for demand forecasting, fraud detection, churn prediction, and pricing optimization. In one documented case, a global car manufacturer used SPSS to analyze warranty data and reduced repeat warranty cases by 5%.
Moreover, SPSS scales from small research datasets to enterprise-level databases. This flexibility is why universities and corporations both rely on it. Coursera’s dedicated course on SPSS predictive analytics is built specifically around this dual audience, covering both academic and applied business use cases.
Core Techniques Behind Predictive Analytics Using SPSS
Predictive analytics using SPSS isn’t a single method. It’s a collection of statistical techniques, each suited to different data types and questions.
Regression Analysis
Regression is the foundation of most predictive models in SPSS. It estimates the relationship between a dependent variable and one or more independent variables. Analysts use it to forecast sales, pricing effects, or demand levels.
Before running regression, it helps to understand how it differs from simpler association measures. This guide on correlation vs regression analysis clarifies when each method applies.
Turn Survey Data Into Business Decisions Faster
Technology-driven market research for faster, smarter insights.
Classification and Decision Trees
SPSS also supports classification techniques like CHAID and random trees. These models split data into branches based on decision rules, making them ideal for predicting categorical outcomes such as customer churn or loan default risk.
Classification models work best with clean, well-prepared data. Analysts typically clean and structure their dataset before running these models to avoid distorted predictions.
Discriminant Analysis
Discriminant analysis predicts group membership based on independent variables. It’s commonly used in market research to classify customers into segments or predict risk categories.
This technique differs from regression because it focuses on predicting categorical groups rather than continuous values. For step-by-step guidance, refer to this walkthrough on discriminant analysis in SPSS.
Multivariate Analysis
Many predictive problems involve multiple variables interacting simultaneously. Multivariate techniques allow analysts to model these relationships together rather than one at a time.
This approach captures complexity that simple regression might miss. Analysts working with multiple predictors often turn to this guide on multivariate analysis in SPSS to structure their models correctly.
Preparing Your Data Before Running Predictive Models
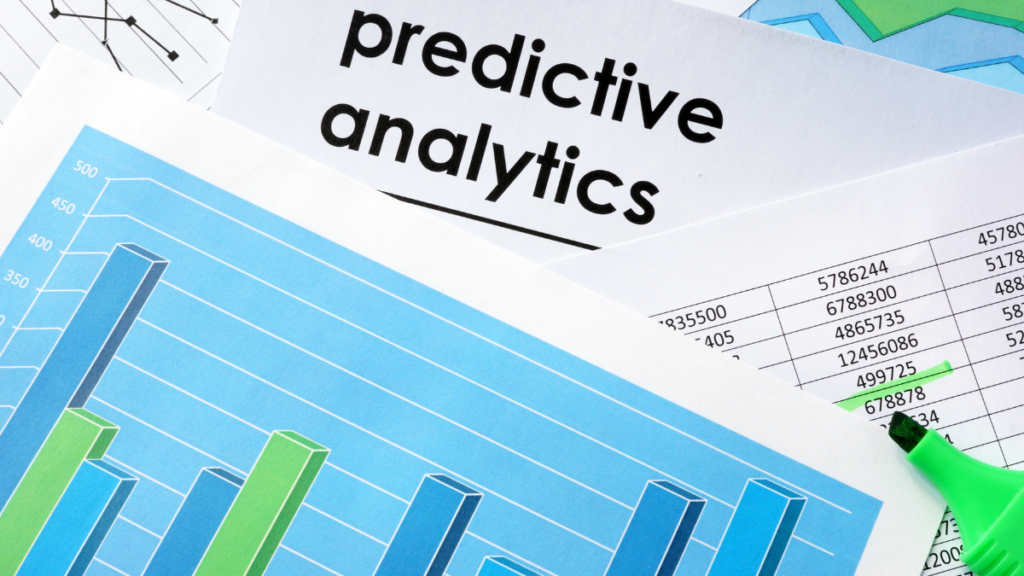
Predictive analytics using SPSS depends entirely on data quality. Poor data leads to poor predictions, regardless of how advanced the model is. Therefore, preparation matters as much as the analysis itself.
Here’s a general preparation checklist:
- Import your dataset correctly from its source
- Check variable types and formatting
- Handle missing or incomplete entries
- Transform variables where necessary
- Validate the dataset before modelling
If your data originates outside SPSS, correct formatting matters immediately. This guide on importing data from Excel to SPSS walks through the process step by step.
Once imported, raw variables often need adjustment before they fit a model properly. This resource on transforming data in SPSS covers recoding, computing new variables, and scaling.
Missing data is another common obstacle. Left unaddressed, it can significantly skew predictive accuracy. This guide on handling missing data in SPSS explains practical ways to clean incomplete records.
Steps to Build a Predictive Model in SPSS
Building a reliable model requires a structured process. Skipping steps often leads to inaccurate or misleading forecasts.
- Define the prediction goal. Know exactly what outcome you want to forecast.
- Prepare and clean the dataset. Ensure variables are accurate and complete.
- Choose the right algorithm. Match regression, classification, or discriminant methods to your data type.
- Train the model. Run the analysis using historical data with known outcomes.
- Validate results. Test the model against a separate dataset to check accuracy.
- Interpret and apply findings. Translate statistical output into actionable business decisions.
This process mirrors the general analytics tutorials many beginners rely on when first learning the software. If you’re new to the platform, this broader SPSS tutorial on data analysis is a useful starting point before attempting predictive modelling.
Turn Complex Datasets Into Strategic Business Growth
Enterprise-grade data processing, statistical analysis, and customized tabulations to power your insights.
How SPSS Compares to Other Predictive Tools
SPSS isn’t the only tool that can forecast outcomes. Business intelligence platforms increasingly offer built-in predictive features too. However, SPSS still offers deeper statistical control, which matters for rigorous research and enterprise-grade modelling.
For teams comparing options, it helps to know what modern BI tools can and cannot do. This overview of whether Power BI can perform predictive analytics is useful context when deciding which platform fits your workflow.
Ultimately, the right choice depends on your data volume, statistical needs, and team expertise. SPSS tends to suit teams needing detailed statistical validation, while BI tools often favor speed and visualization.
Common Challenges When Using SPSS for Prediction
Even experienced analysts encounter obstacles when building predictive models. Recognizing these early prevents wasted effort later.
- Overfitting: Models that fit training data too closely often fail on new data.
- Poor variable selection: Including irrelevant predictors weakens model accuracy.
- Small sample sizes: Limited data reduces prediction reliability.
- Ignoring assumptions: Techniques like regression require specific statistical assumptions to hold.
Addressing these challenges early improves both accuracy and trust in your results. Additionally, documenting your modelling decisions makes it easier to defend and reproduce findings later.
Real-World Applications of Predictive Analytics Using SPSS
Predictive analytics using SPSS extends far beyond academic research. Documented case studies show measurable impact across industries. A police department using SPSS-driven analysis reportedly reduced crime rates by 30% and significantly improved conviction rates. A medical analytics company used predictive modelling to reduce bad debt exposure by an estimated $50 million.
These examples demonstrate why predictive analytics using SPSS remains relevant despite newer analytics tools entering the market. The combination of statistical depth and practical usability keeps it a preferred choice across industries.
Program Complex Questionnaires and Skip Logic
Expert survey scripting, advanced routing, and multi-language configurations for flawless data collections.
Conclusion
Predictive analytics using SPSS gives analysts a powerful way to forecast outcomes with statistical confidence. From regression and classification to discriminant and multivariate techniques, SPSS offers multiple pathways depending on your data and objective.
Success ultimately depends on careful data preparation, thoughtful technique selection, and disciplined validation. Start with clean data, choose your model deliberately, and always test results before applying them to real decisions.
Frequently Asked Questions
It forecasts outcomes like customer churn, sales trends, fraud risk, and demand levels based on historical data patterns.
Classification methods like CHAID, random trees, and discriminant analysis work best for predicting categorical outcomes.
No. SPSS offers a graphical interface, so you can build most predictive models without writing code.
Regression predicts continuous numeric values, while classification predicts categorical group membership.
Skipping data cleaning. Missing values and poorly formatted variables significantly distort prediction accuracy.